
Let’s subscribe to the idea
It is a key decision to find the right business model when building a new product and it is generally as important as the features you bring to the table. For quite a number of years subscription-based services seem to be the way to go and even more traditional businesses try to offer subscription as an alternative in their portfolio. It is less upfront investment, especially for small businesses, so instead of paying thousands or tens of thousands of dollars for a software tool, you can go with a 50 bucks a month subscription plan to see if it really fits your business needs in practice. It is easier to calculate and plan with, the monthly price often includes technical support, upgrades to new versions and some IT or hardware-related expenses as well (think about cloud-based products) and it is as much of a win for the provider as well as it creates what we call “recurring revenue”.
Most of the concepts around SaaS are fairly easy to grasp (in my humble opinion) but it is really easy to get lost in all the abbreviations and terms SaaS veterans use as KPIs (key performance indicators) if you are new to the topic so I created this article to get you quickly rolling and understand easily things like MRR, CAC, LTV and so on.
MRR and ARR
MRR stands for Monthly Recurring Revenue and it basically means the number of subscriptions you bill each month. The recurring nature of such businesses makes them so exciting for investors as it provides a really predictable revenue flow if everything is done right. MRR x 12 leads to ARR, so Annualized Run Rate is a great metric to estimate the yearly revenues the company will be able to generate.
There are usually options to buy annual subscription plans and that is usually offered with a slight discount. If you want to offer something like that and make your customers commit to a longer period, I find that charging 11 months worth of fee as a yearly sum is generally considered a good deal by most of the clients. Please keep in mind that if your annual fee is USD 180, you just add it when calculating ARR but you need to divide it by 12 when you are calculating MRR so it is only worth USD 15 in your monthly metrics.
Churn and Customer Lifetime
In an ideal world, there would be no cancellations and everything would be perfect forever but in reality, you need to come up with predictions and measurements for customers leaving your platform as not all of them will stay indefinitely. Let’s say we had 100 brand new users at the beginning of January but out of that hundred, 10 decided to skip renewal in February. If we divide the number of customers lost by the customers at the beginning of that same period we get our Churn Rate. So, 10/100 is 10% for our fictional January month. Please note that new subscriptions in February shouldn’t be counted here.
Churn rate is wonderful as it allows you to calculate the average lifetime of a customer so the avg number of months the client will use your service. The formula is fairly straightforward, 1 / Churn = months of lifetime. In our case, one divided by ten is 10 months of lifetime. This is an average so you will see that with a 10% Churn rate:
- Month 10 you will still have around 38 customers
- In fact, 2 years later, around month 24 you will still have roughly 9
- Even at month 48 you will still have 1 from the original batch or cohort but more on that later
The lower the churn rate is the happier we are as it means the average customer lifetime is longer. At 7% it is around 14 months and at 4% it is more than two years, 25 months to be precise. This range by the way is considered as a healthy churn rate and indicates that your product or service is performing well.

CAC and Lifetime value (LTV)
Now that we know the average lifetime a customer spends with us, we can go one step further and start calculating the money they spend during that period. There is ARPU – average revenue per user but I actually like ARPA so average revenue per account better as it indicates more clearly that we are concentrating on the accounts we have. For example, if the entire sales team within a company uses Hubspot, they might have 20 or 50 user seats in the software but from Hubspot’s perspective this company is one account and that will be the basic unit of their revenue calculation. To get your ARPU, you simply divide the MRR so your monthly recurring revenue by the number of customers you have and you get your average income per account. Let’s say we earn USD 25 000 every month and have 900 customers, it is easy to see that they spend roughly USD 28 per month.
If we continue this and multiply the ARPU by the average customer lifetime months, we get our LTV or customer lifetime value. Our calculation is:
- MRR: USD 25 000
- AVG number of customers: 900
- Churn: 7%
- AVG lifetime: 14 months
This makes our customer lifetime value to be 14x USD 28 so USD 392. This is the average revenue we can expect from an account on average.
Now that we know the revenue we can reliably hope from a new user, it is a natural thought to calculate how much we can spend on getting that new customer on board. This is called CAC or customer acquisition cost and it is considered to be the sum of all sales and marketing efforts you spend on getting that customer. Usually, people refer to this simply as CAC but what they really mean is blended CAC as it has, sales and marketing and paid and organic conversions as well.
Our usual costs are:
- SEO – search engine optimization
- PPC – pay per click, paid advertisements
- PR costs
- Marketing payroll
- Sales payroll and commissions
- Event and travelling costs
- Other associated costs
You can calculate a monthly average of these spendings and as we already know the average number of new customers you acquire each month, it is easy to come up with the average customer acquisition costs. If we spend USD 6000 each month on sales and marketing and have 100 new users on average, our CAC is USD 60. As our customer lifetime value is USD 392 we are more than good and in fact, it indicates that we can be a little bit more aggressive with our marketing spendings for example.
Adjustments and guidelines
Before we continue further with some more advanced concepts, please allow me to share some of my personal tips with you.
- Your CAC is generally considered to be good if it is one-third or less of your customer’s lifetime value. If it looks low, it indicates that you can spend more to buy market share which is good, go for it.
- For products where there is a significant difference in the pricing tiers and you feel that the target customers are different enough so for example if your lowest tier is more for SMBs and the highest is for enterprise customers and their customization needs, I would advise to do the calculations per tier to have a more accurate reading. Have a customer lifetime value per tear, have average revenue per account calculated for every tier.. etc. This can also show you which group you need to focus more on and where you will see the most profit.
- Use adjustments. For example, not all of your sales efforts go into new customer acquisition, usually there is time spent with retention and upsell, if you don’t have a separate team, your sales staff might also be responsible for account management so compensate for that in your numbers. I generally also like to build in margin compensations or gross margin compensations if needed.
It is good to build all these calculations on historical numbers and have your numbers linked to assumptions if you use any. So, if your product is still in an early startup stage and you assume that you will have 2x as many new customers next year, build your sheet in a linked way so if you change the assumption to x1.5 it automatically adjusts all the values that are built on that assumption.
Cohorts and other advanced metrics
So far, we have been talking about customer churn and we were focusing on customers fully leaving the platform. However, if you offer multiple tiers in your subscription setup you will see a number of people upgrading and downgrading their plans from time to time. The terminology for that is:
- Lost
- Retention
- Contraction
- Expansion
- Reactivation
I don’t feel we really need to define the first four but reactivation can be a great revenue source and a fairly easy-to-define target group when planning campaigns. There is usually not just money there you can grab but also valuable market information and some competitor info as well so don’t forget that group.
Let’s approach churn from the revenue perspective and calculate our Gross Revenue Churn. To do that, we simply divide our lost revenue by the MRR at the beginning of that period. To stick to our earlier example, it is easily possible that your customer churn is 10% but due to people downgrading their plans we see a higher, 13% or 14% actual gross revenue churn.
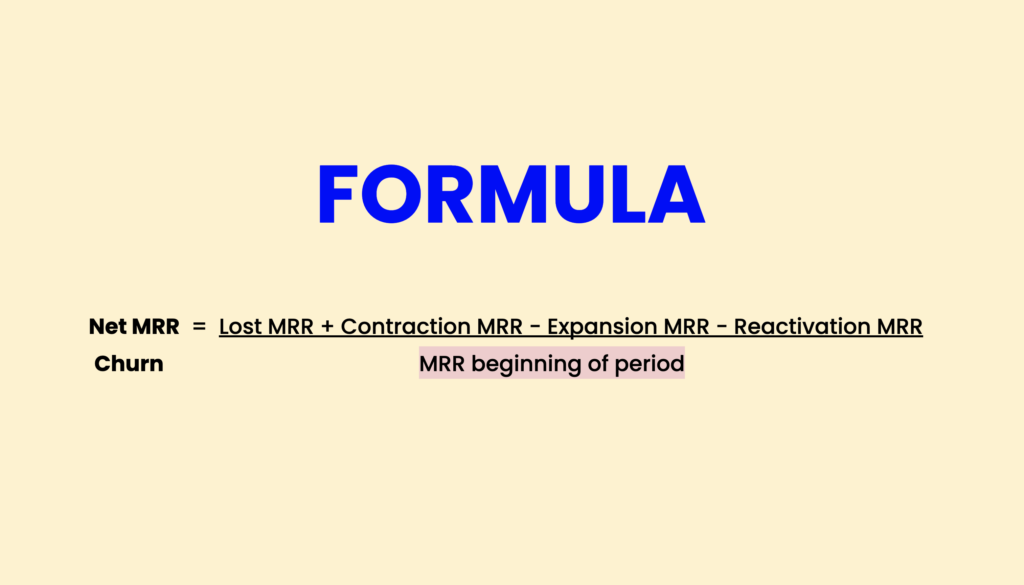
To go one step further and have everything calculated in one equation, we calculate Net MRR Churn. In this formula we take all the revenue options into account, so lost MRR, contraction MRR, expansion MRR and reactivation MRR are all being taken into account. We add the lost and contraction revenues, deduct the expansion and reactivation revenues and divide the sum by the MRR at the beginning of our period.
Please don’t be alarmed if you get a negative value as the end result, it is probably not your math skills. If you see -4.2% as your Net MRR Churn, it means that your business is actually growing, on top of the new customers you acquire, you are also making more and more money from the existing customers. This negative churn is what SaaS CEOs strive for.
When planning, it is worth looking into changes on a cohort basis. A cohort is a group of users that share some characteristics, they have a shared behavior or traits like they joined in the same month or they were all part of the same campaign you started. Such cohort-based metrics can be extremely useful when you try out a new marketing channel for example. If you see that there are many new customers joining during your Black Friday discount period but their churn rate is much higher than your usual average, you see that such heavy discounting results in low-quality leads so you might go for a different strategy.
We have built numerous SaaS tools over the years here at Canecom and feel like we have learnt some really valuable lessons that we are happy to share. If you need more tips and tricks, please contact us directly anytime for a friendly chat.